13 Tips on How To Use Infographics for Your Email Marketing
Brett Jordan/Unsplash
Marketers are always on the lookout for new ways to engage their audience. One way they can do this is through infographics, which are visual representations of data or information. This article presents 13 tips on how to use infographics in your email marketing strategy.
1. Keep It Simple.
Keep it simple and easy to understand when creating an infographic for your email marketing campaign. You don’t want your audience to be overwhelmed by the information you’re presenting.
2. Make It Interesting.
Your infographic should be visually appealing and engaging so that people will want to read it. Use interesting fonts, colors, and graphics to capture your audience’s attention.
3. Use Graphs and Charts.
Graphs and charts are a great way to present data in an easy-to-understand format. They can help you illustrate your points more effectively.
4. Keep It Short.
Infographics can be quite long because of all the graphics and data you’re presenting. Try to keep your infographic below 200 words, including images.
5. Use Relevant Data.
Make sure the data you include in your infographic is relevant to your audience. Don’t include information that is not applicable or interesting to them.
6. Use Humor.
People respond to humor. If your infographic includes a humorous section, try using a meme or an animated GIF. You can convert your MOV files to gifs using this tool from Adobe.
7. Connect With Your Audience.
When creating an infographic for email marketing, think about your audience’s interests and tailor the information you present accordingly. For example, if they’re avid readers of a certain blog, include data from that blog in your infographic.
8. Make It Shareable.
Make sure your infographic is easy to share on social media. Include social media buttons so people can easily share them with their friends and followers.
9. Use Infographics as a Lead Magnet.
If you want to increase the number of leads you generate, use an infographic as a lead magnet. Offer it as a free download in exchange for people’s contact information.
10. Use Data To Create Controversy.
Controversy always gets people’s attention. If you can find data that will create a controversy, go for it! Just make sure you’re prepared to back up your claims with credible sources.
11. Don’t Include Too Many Images.
A good infographic should have a good mix of data and visuals, but don’t go overboard with the graphics. Too many images can make reading difficult, especially if your audience engages with the infographic on mobile devices.
12. Place Key Takeaways at the Beginning.
The first part of your infographic should include the most important takeaways, so place them at the beginning. You can also use this section to describe your infographic and how it will benefit the reader.
13. Use Infographics for Social Media Posts.
Infographics work well on social media because they’re easy to share, and people like to interact with them. Use infographics to generate interest in your email marketing campaigns.
Extra Tip: Use Venngage Infographics.
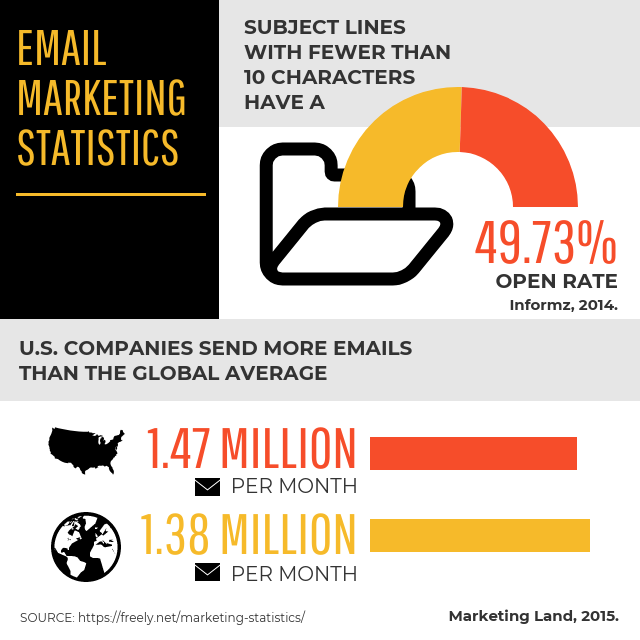
If you are having trouble making your own infographics from scratch, use Venngage — a free infographic maker that provides the best infographics for everyone to use. To give you an idea, here are some cool infographic examples from their page.
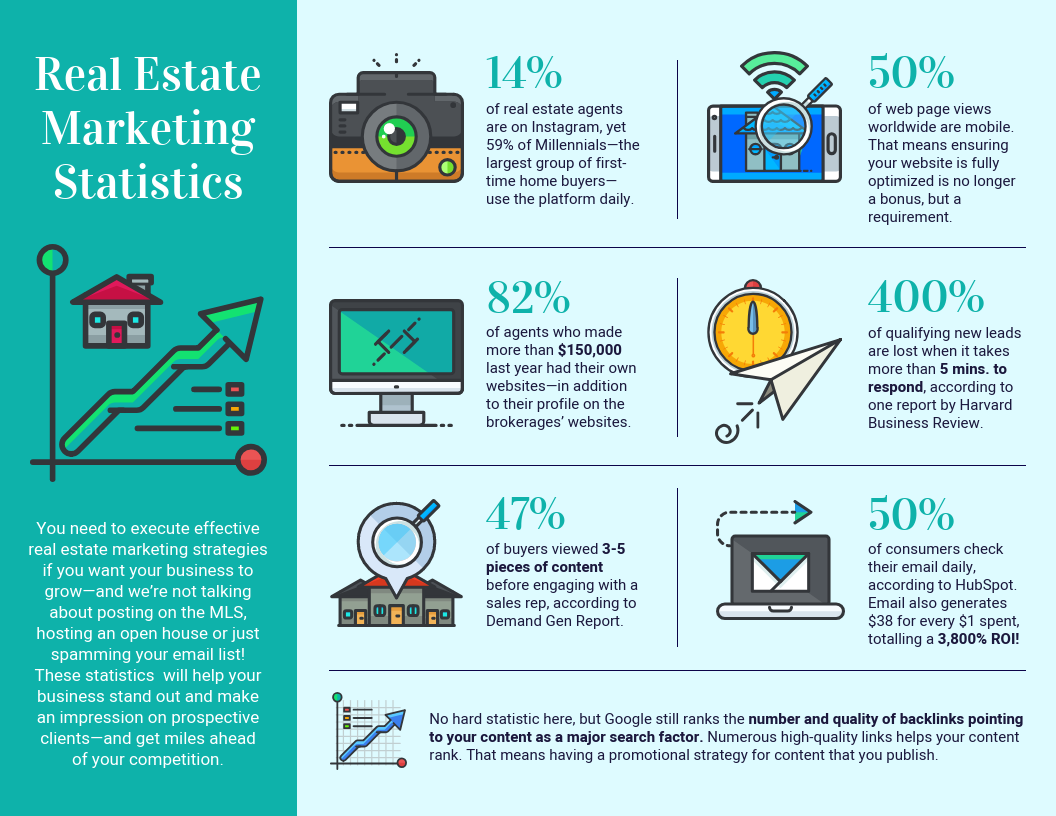
Venngage
Venngage

Venngage
Common Mistakes Marketers Make When Using Infographics
While infographics are a great way to engage your audience, marketers make some common mistakes when using them. Here are three of the most common ones:
1. Not Tailoring the Information to Their Audience.
When creating an infographic, make sure you tailor the information to your audience. Don’t include information that is not applicable or interesting to them.
2. Using Too Many Images.
Including a good mix of data and visuals is important, but don’t go overboard with the graphics. Too many images can make it difficult to read, especially if your audience is engaging with the infographic on mobile devices.
3. Not Including a Call-To-Action.
A call-to-action is an essential part of any marketing campaign, so don’t forget to include one at the end of your infographic. You can ask people to subscribe to your email list or visit your website.
4. Not Making It Shareable.
Make sure your infographic is easy to share on social media. Include social media buttons so people can easily share them with their friends and followers.
5. Using Infographics as a Crutch.
Don’t rely entirely on infographics to generate traffic for your email marketing campaigns. Combine them with other types of content to get better results.
Infographics are a great way to engage with potential customers and increase the number of leads you generate for your business. Use the tips above to create effective infographics for email marketing and watch your engagement increase. What are you waiting for? Make your own visuals and boost your email marketing strategy with Vennage today!